
[ Home ] • [ Services: Support | Directed Development | Consulting ] • [ Technology: Overview | Examples ] • [ Profile ] • [ Contact ]
HPCToolkit is an integrated suite of tools for measurement and analysis of program performance on computers ranging from multicore desktop systems to the nation's largest supercomputers. By using statistical sampling of timers and hardware performance counters, HPCToolkit collects accurate measurements of a program's work, resource consumption, and inefficiency and attributes them to the full calling context in which they occur. HPCToolkit works with multilingual, fully optimized applications that are statically or dynamically linked. Since HPCToolkit uses sampling, measurement has low overhead (1-5%) and scales to large parallel systems. HPCToolkit's presentation tools enable rapid analysis of a program's execution costs, inefficiency, and scaling characteristics both within and across nodes of a parallel system. HPCToolkit supports measurement and analysis of serial codes, threaded codes (e.g. pthreads, OpenMP), MPI, and hybrid (MPI+threads) parallel codes.
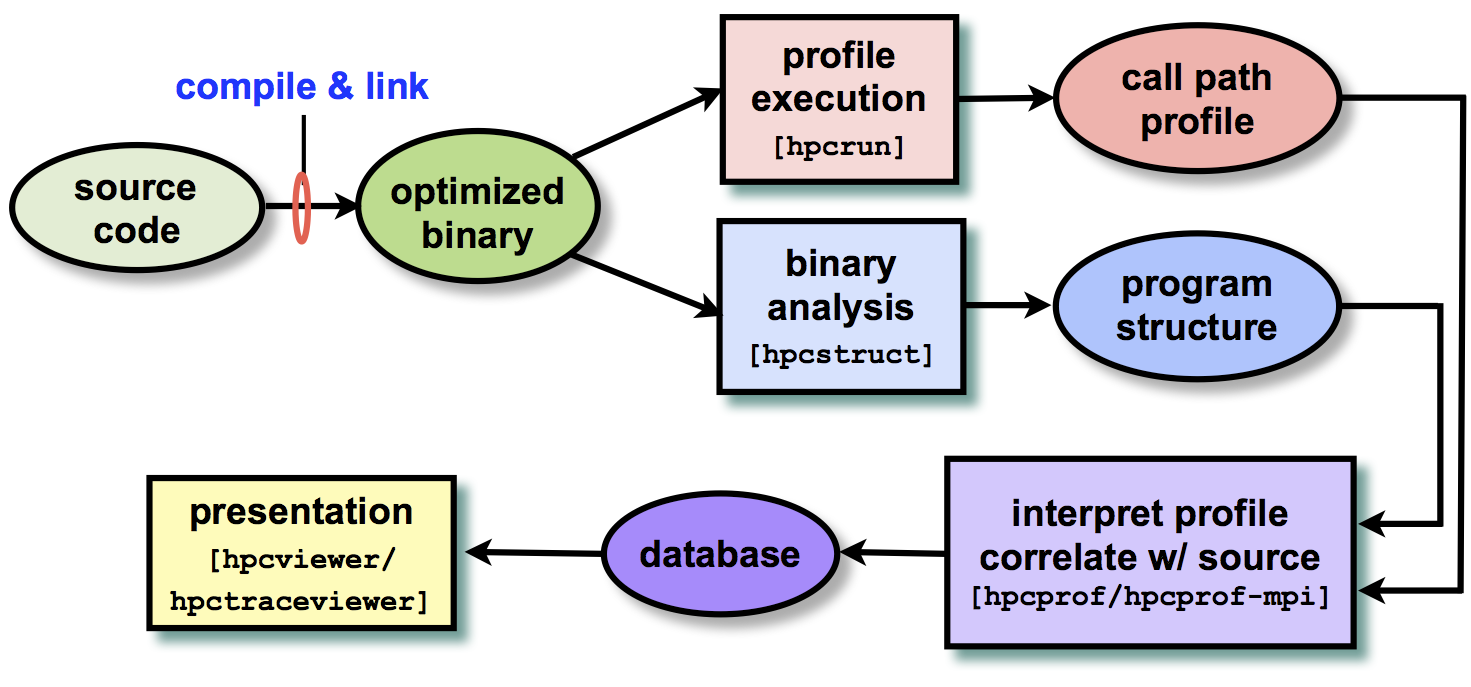
The figure below illustrates HPCToolkit's primary components and their relationships.
hpcrun: hpcrun collects accurate and precise calling-context-sensitive performance measurements for unmodified fully optimized applications at very low overhead (1-5%). It uses asynchronous sampling triggered by system timers and performance monitoring unit events to drive collection of call path profiles and optionally traces.
hpcstruct: To associate calling-context-sensitive measurements with source code structure, hpcstruct analyzes fully optimized application binaries and recovers information about their relationship to source code. In particular, hpcstruct relates object code to source code files, procedures, loop nests, and identifies inlined code.
hpcprof: hpcprof overlays call path profiles and traces with program structure computed by hpcstruct and correlates the result with source code. hpcprof-mpi handles thousands of profiles from a parallel execution by performing this correlation in parallel. hpcprof and hpcprof-mpi generate a performance database that can be explored using the hpcviewer and hpctraceviewer user interfaces.
hpcviewer: hpcviewer is a graphical user interface that interactively presents performance data in three complementary code-centric views (top-down, bottom-up, and flat), as well as a graphical view that enables one to assess performance variability across threads and processes. hpcviewer is designed to facilitate rapid top-down analysis using derived metrics that highlight scalability losses and inefficiency rather than focusing exclusively on program hot spots.
hpctraceviewer: hpctraceviewer is a graphical user interface that presents a hierarhical, time-centric view of a program execution. The tool can rapidly render graphical views of trace lines for thousands of processors for an execution tens of minutes long even a laptop. hpctraceviewer's hierarchical graphical presentation is quite different than that of other tools - it renders execution traces at multiple levels of abstraction by showing activity over time at different call stack depths.
Highlighted platforms:
©2012